Example: 1D imaging of two spots
Here we present an example of the concept detailed in the previous section. Assume we have two spot-like samples in the  plane in the positions
  and
and  . Let's use a simple FID sequence with constant
  gradient right after the pulse, during the acquisition. The sequence diagram is shown in Figure 1.
Figure 1. Left: two spot samples to be imaged. Right: Sequence diagram of a simple 1D imaging FID with constant readout gradient.
The phase evolution of the spins in the two samples with a gradient strength  :
:
 (1)
(1)
Their complex demodulated signal:
 (2)
(2)
The spatial frequency vector  now only has component:
 (3)
(3)
Hence the signal as a function of spatial frequency:
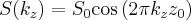 (4)
(4)
The spatial spin density is obtained by the inverse Fourier transform of the signal, now only in one dimension.
![\label{1D_imaging5}
\rho(z) = \int \mathrm d k_z 2 S_0 \mathrm{cos} \left( 2 \pi k_z z_0 \right ) \mathrm{e}^{-\mathrm i 2 \pi k_z z} = S_0 \int \limits_{- \infty}^{\infty} \mathrm d k_z \left(\mathrm{e}^{\mathrm i 2 \pi k_z (z+z_0)} + \mathrm{e}^{\mathrm i 2 \pi k_z (z-z_0)} \right)= \\
= S_0 \left [ \delta (z+z0) + \delta (z-z_0) \right]](lib/equation/pictures/50f405734ef47f5af96fc2f699edceea.png) (5)
(5)
As can be seen, the inverse Fourier transformed signal gives back the original spot-like spin density along the direction.The illustration of the signal and the trajectory in  -space are shown in Figure 2.
Figure 2. Upper left: Laboratory signal of the two spot-like samples with its envelope. Lower left: Real part of the demodulated signal forming a cosine. Right: trajectory in k-space. Note that the maximal reached k value is proportional to the acquisition (or sampling) time Ts.
Sidebar
Site Language: English
Theme: Tikinewt